



Monitor your sites and servers
Use the Monitoring page to see which sites are up, how fast they answer and which problems need your attention, then drill into a single site or server.
On this page
Before you start
- At least one site in Nuvlo. See Create a site.
Step 1 Open Monitoring
In the sidebar, select Operations, then Overview under Monitoring. The header shows how many servers are online, for example 3/3 servers online, and how many alerts are open.
Step 2 Check the active alerts
If something needs attention, the Active alerts card lists it, newest first. Click an alert to open the page where you can fix it.
| Alert | When it appears |
|---|---|
| Deploy failed on a site | A deployment failed in the last 7 days. |
| SSL certificate expiring in N days | A domain's certificate expires within 14 days. |
| Disk usage at N% on a server | A server's disk is more than 85% full. |
| A server is reporting an error state | A server has the status Error. |
| A site is not responding | The last uptime check of a site failed. |
Alerts go away by themselves once the cause is fixed, for example when a certificate is renewed or the site answers again. A failed deploy stays in the list for 7 days, even after a later deploy succeeds.
Step 3 Read the site cards
Each site has a card with its domain, its server and a status: Online, Offline or No data yet. The small chart shows the response times of recent checks. Sites with alerts come first.
- Response: the average response time of successful checks over the last 30 days.
- Uptime (30d): the share of checks in the last 30 days where the site answered without a server error.
- Incidents: failed checks among the 40 most recent.
- Last downtime: when a check last failed, or Never.
Step 4 Look at a single site
Click a site's domain to open it.
- On a WordPress site, the Overview tab shows whether the site is Online or Offline. Click Check again for a fresh check.
- On other sites, open the Monitoring tab and the Uptime view. It shows Observed uptime, Average response, the last HTTP status, the Last incident and a strip of recent Availability checks. Click Check uptime now for a fresh check.
The same view shows Server resources: live CPU, memory and disk use of the server, plus Process uptime and Restarts for Node apps. A high restart count often means the app keeps crashing. Check its runtime logs.
Step 5 Check the status of every server
Click Help at the bottom of the sidebar and go to Server status. The table lists each server with its region and status. The summary at the top says All servers running or how many servers need attention.
Click Manage to open a server. For CPU, memory, disk and network history, see Read server graphs.
How uptime checks work
Nuvlo requests the site's domain over HTTPS, and over HTTP if HTTPS doesn't answer. A check passes when the site answers within 10 seconds without a server error (a status code of 500 or higher).
Nuvlo checks every active site every 5 minutes, whether or not anyone has the dashboard open. Opening the Monitoring page or a site's page adds a fresh check, at most once every 30 seconds per site. Stopped sites and sites paused over your plan limit aren't checked.
Get told when a site goes down
When a site fails two checks in a row, Nuvlo sends a notification that it is down, with the status code it answered with or No answer. When it answers again, a second notification says it is back up and how long it was down.
The account owner also gets both by email. To stop the emails, open Notifications and turn off Email me when a site goes down in the Email card. The notifications in the dashboard keep coming.
Related guides
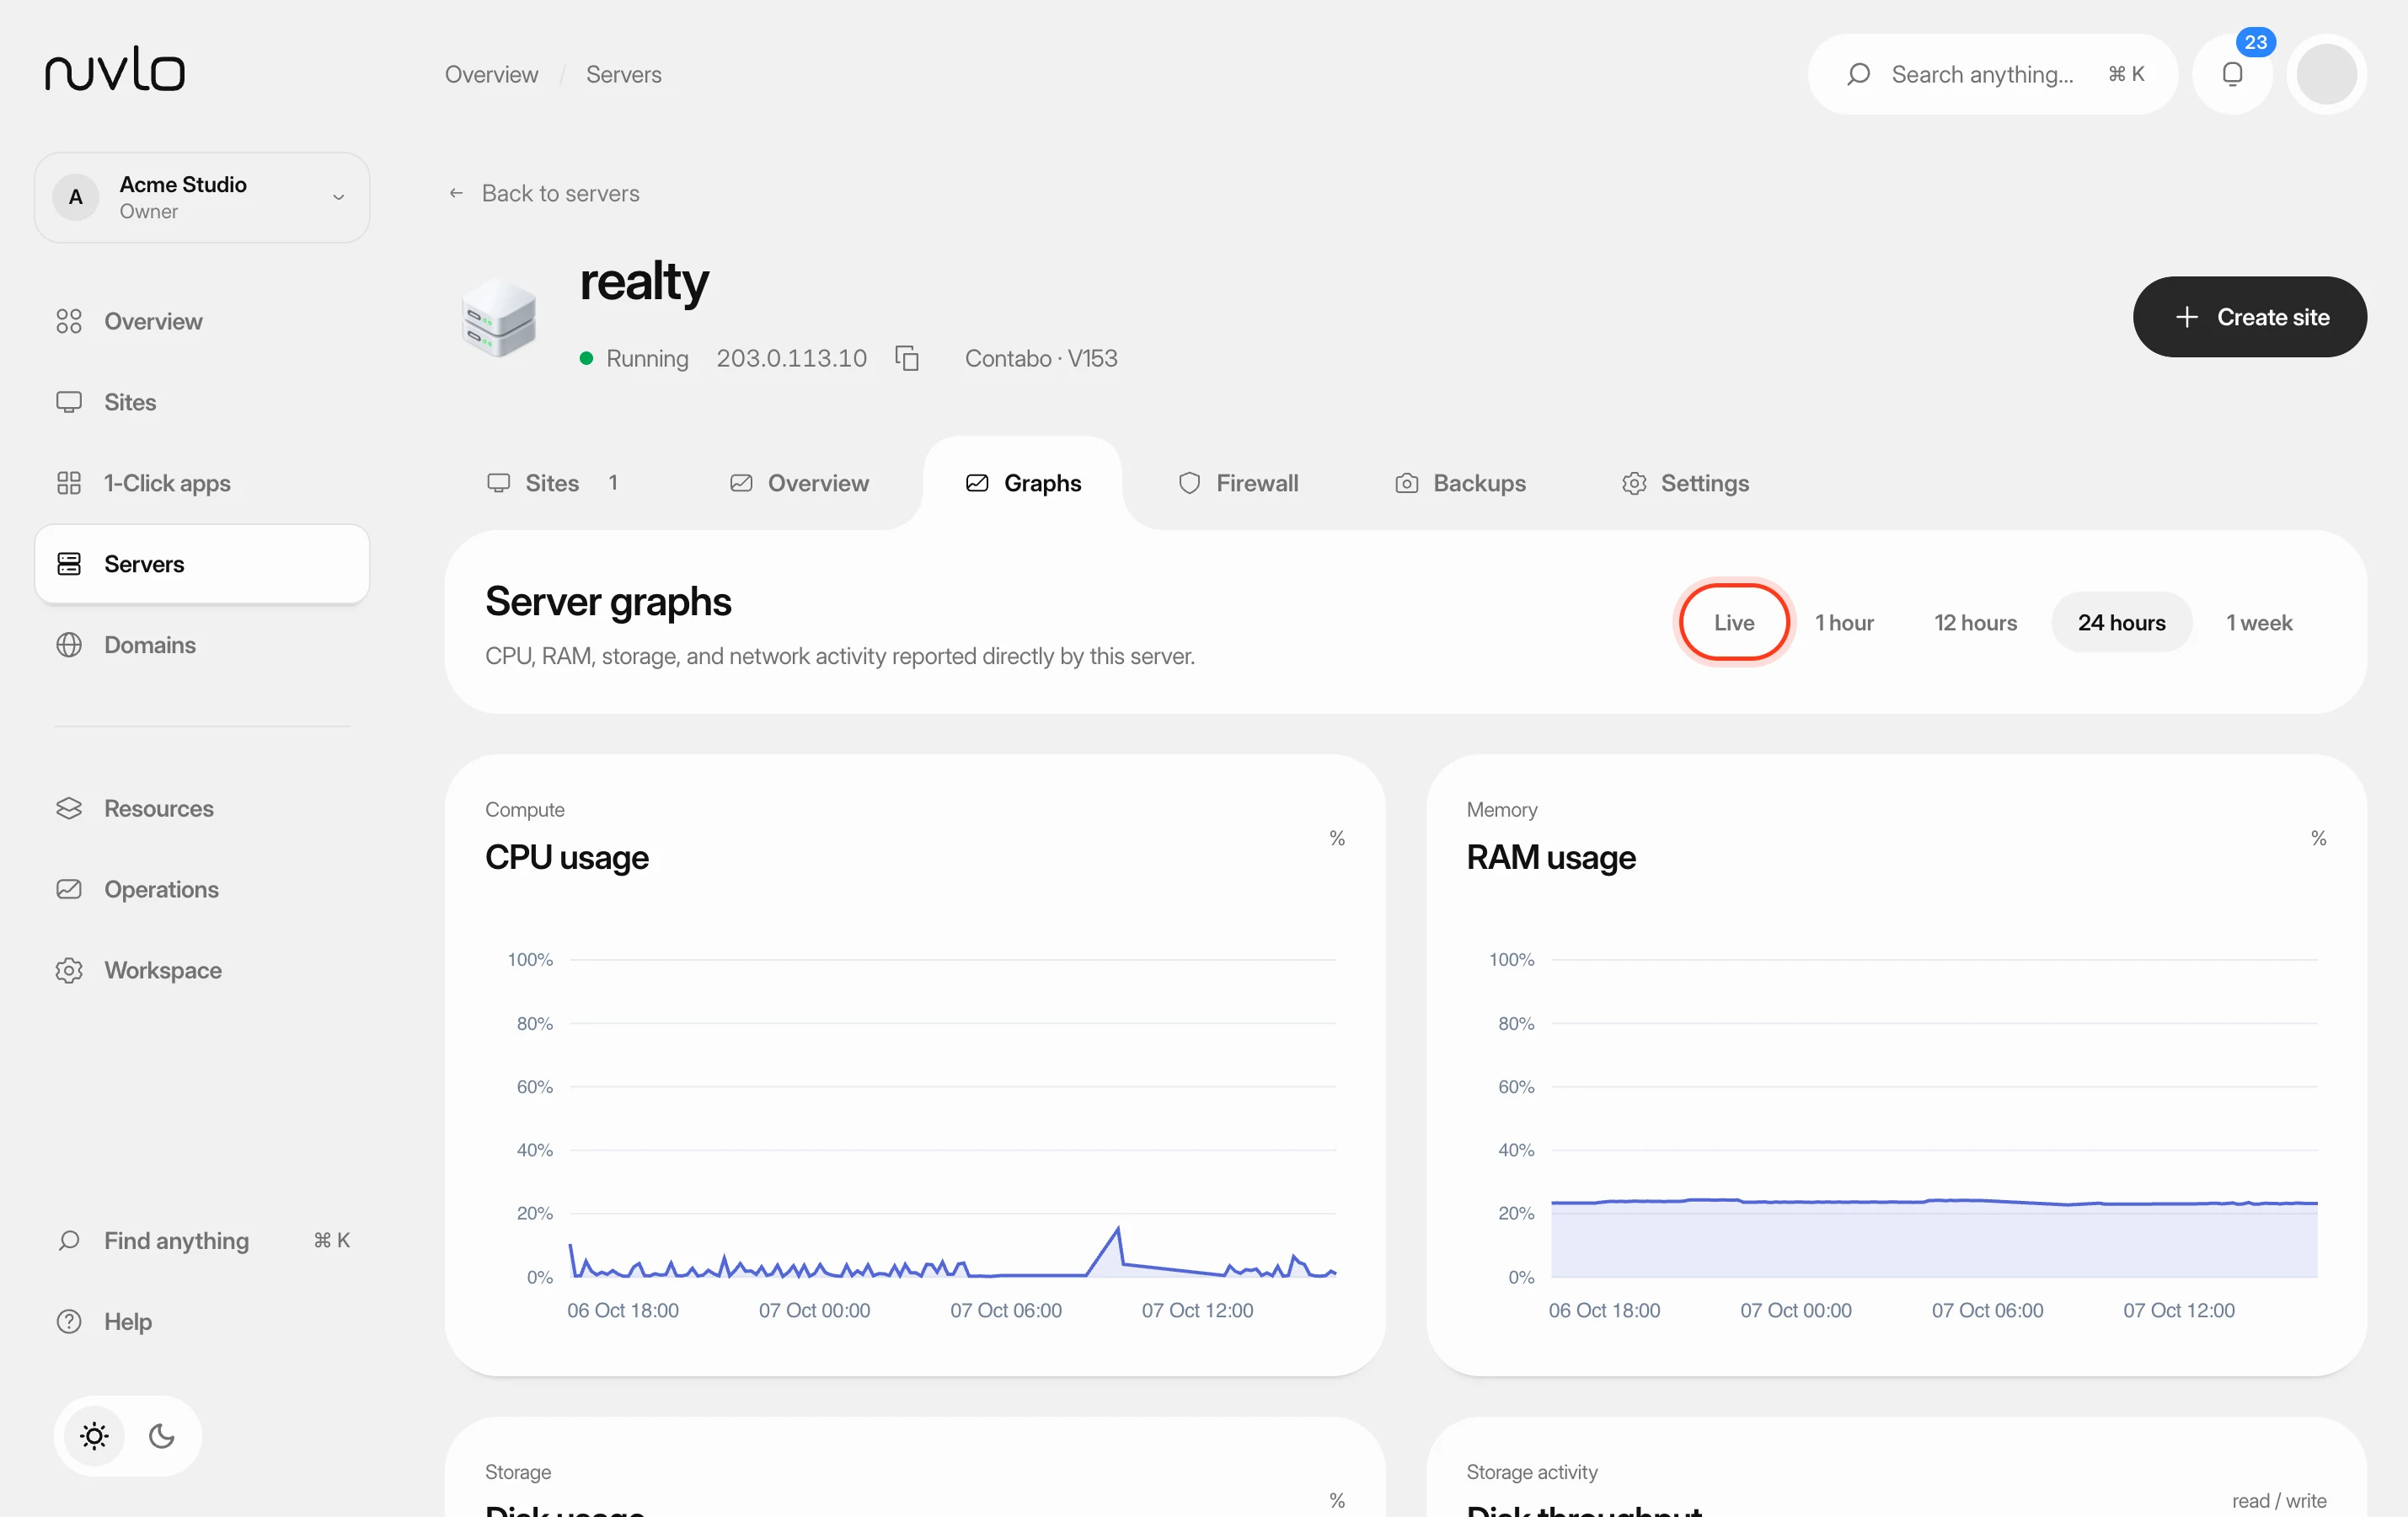 Read server graphsFollow a server's CPU, memory, disk and network use over the last hour, day or week, so you can spot a full disk or a busy server before it causes trouble.
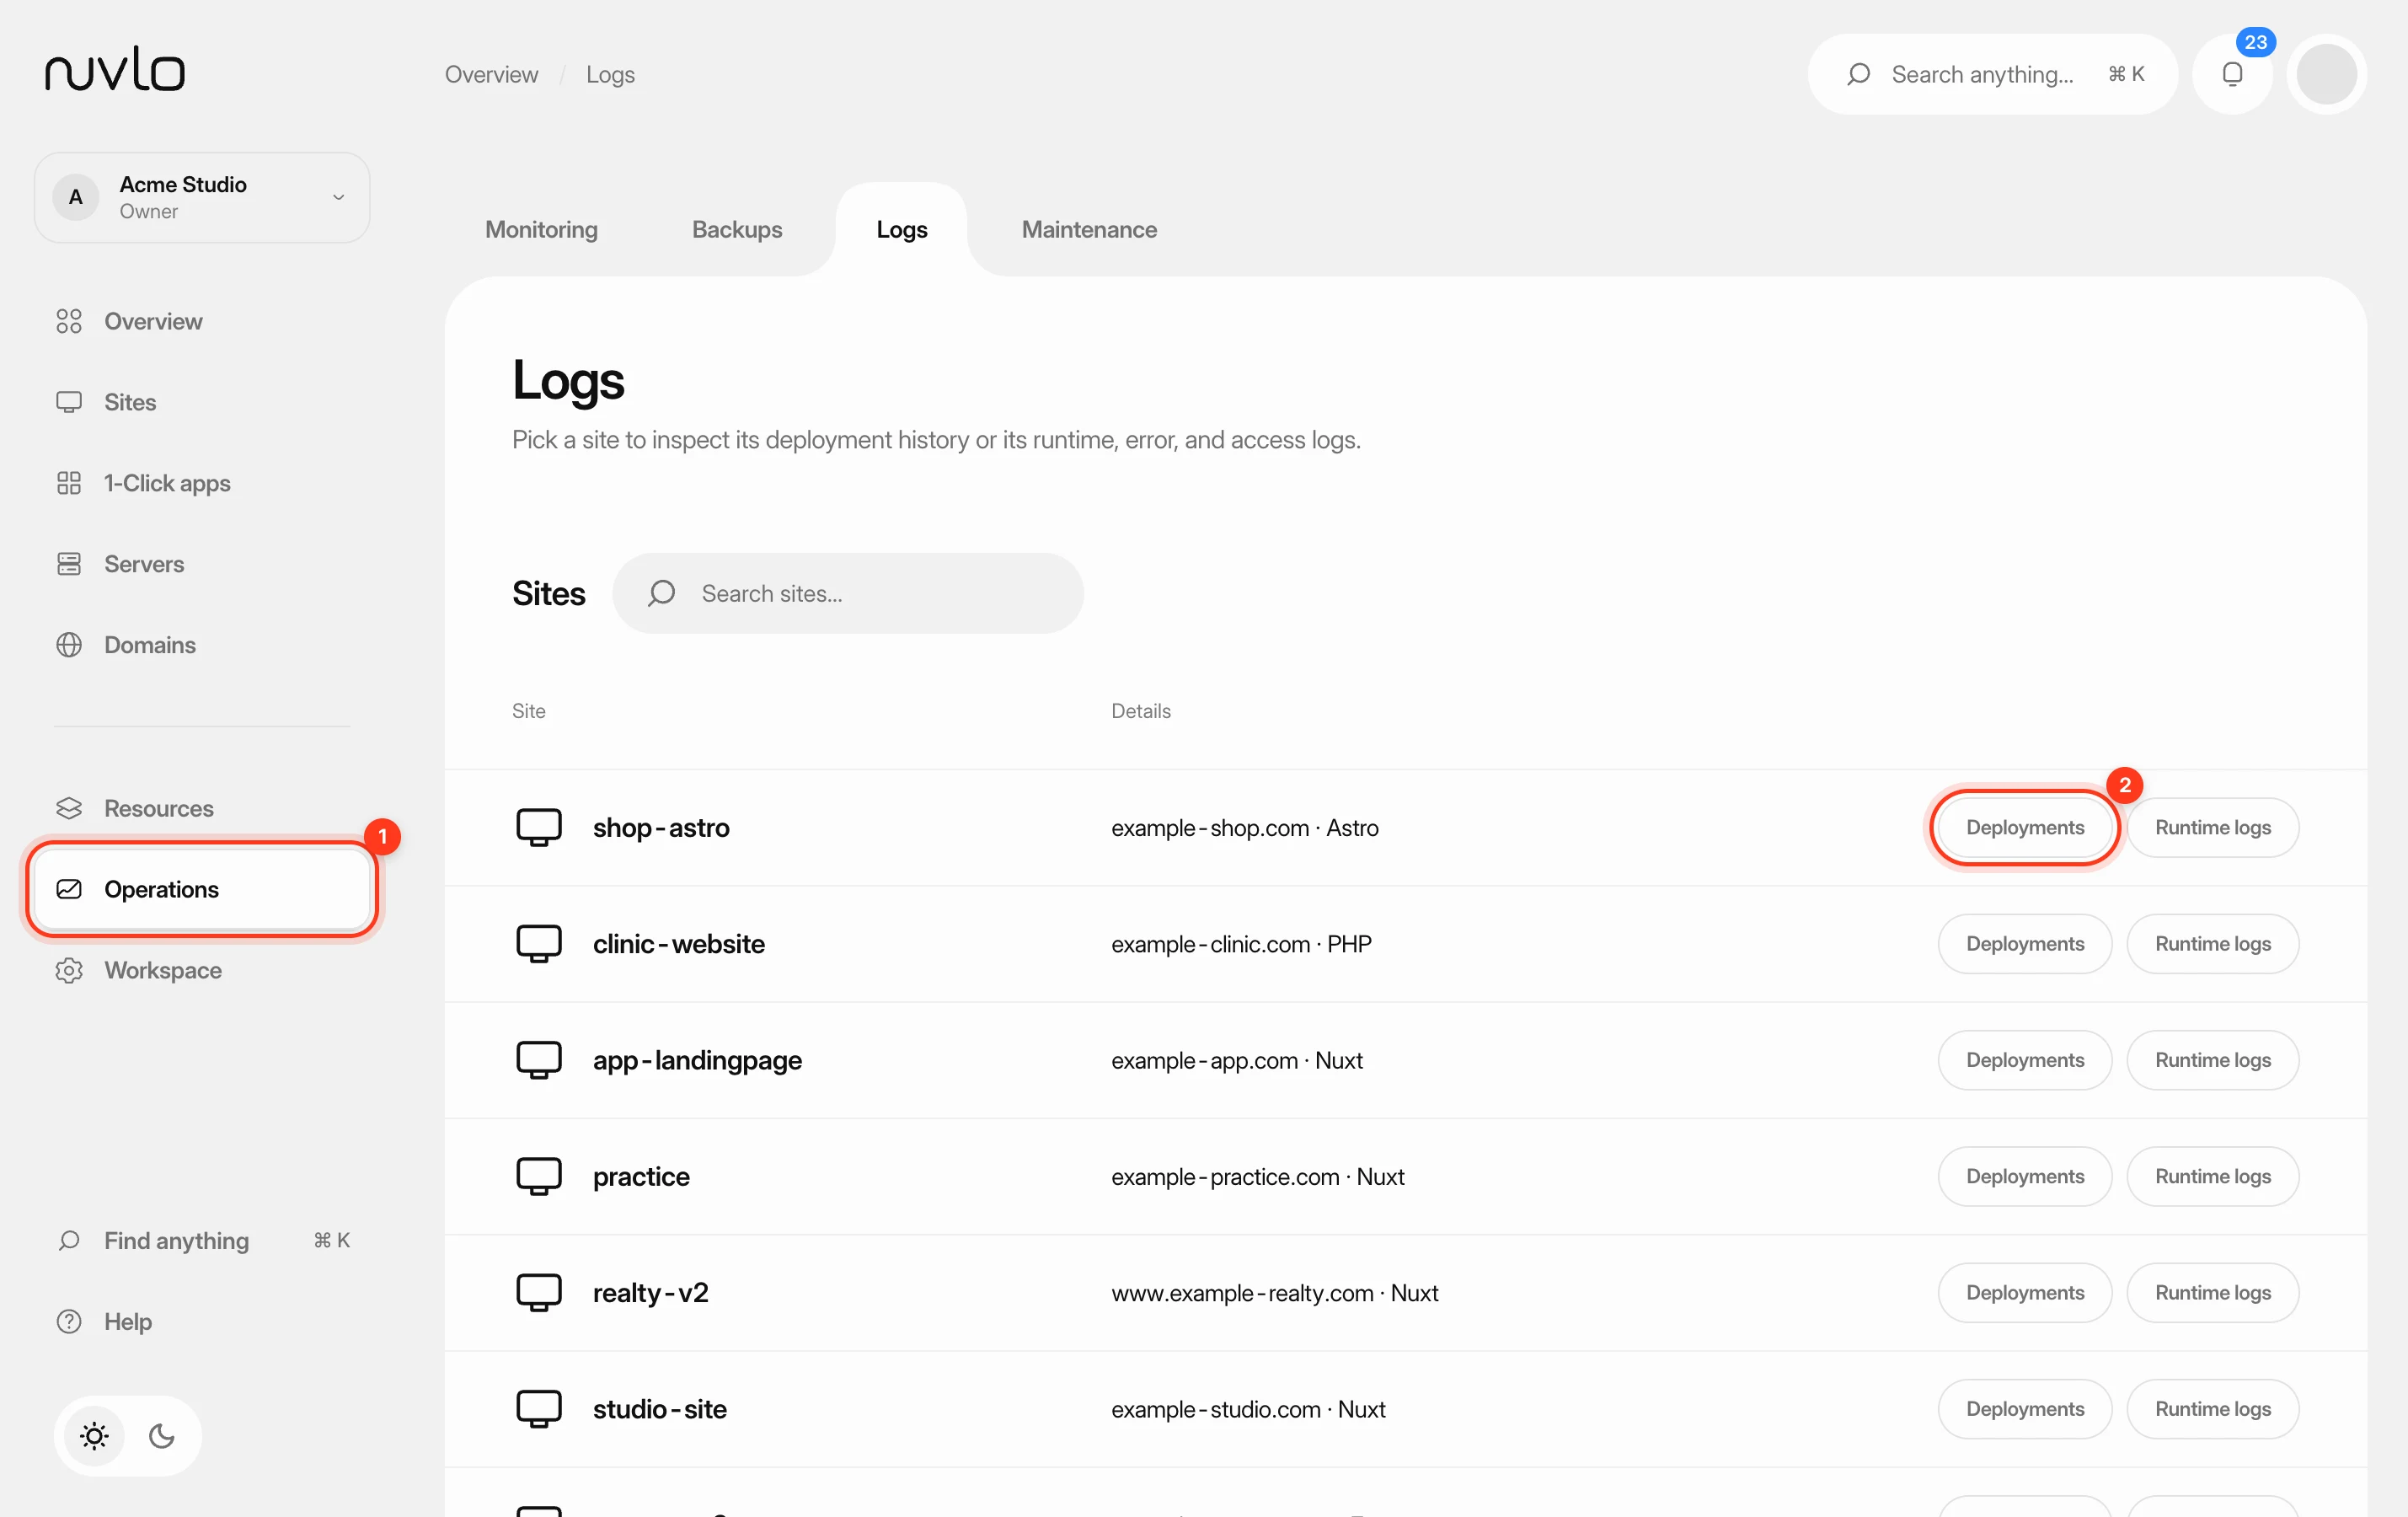 Read deployment and runtime logsFind out why a deploy failed or what your app is doing right now, using the build logs of each deployment and the live runtime logs of a site.
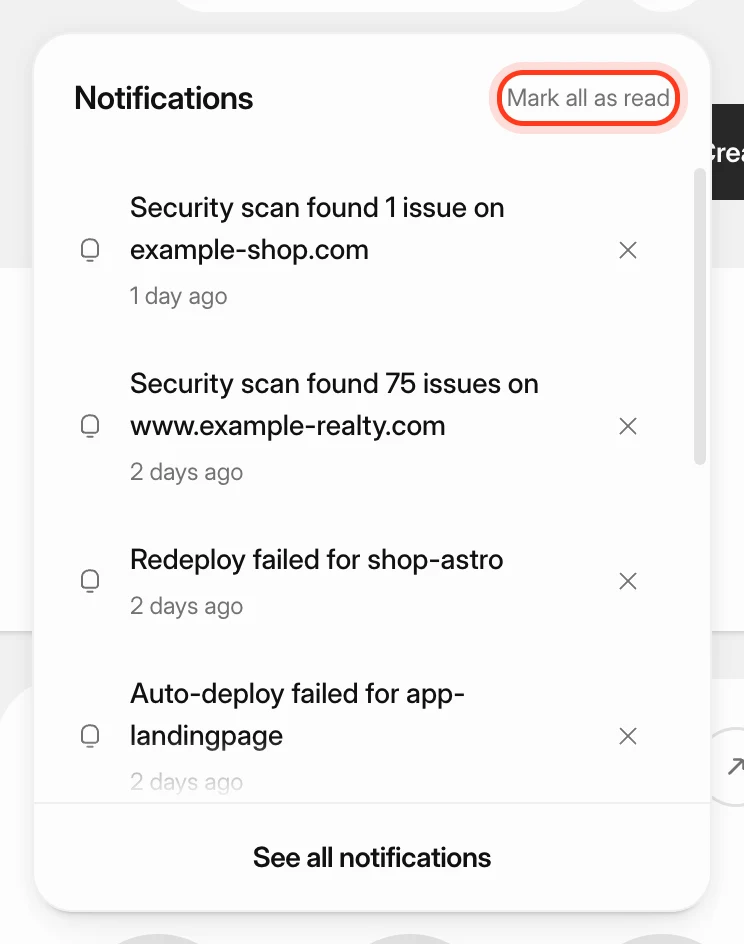 Manage notificationsKeep track of finished deploys, new servers, scan results and failures with the notification bell and the Notifications page, and send alerts to Slack, Discord, Microsoft Teams, Telegram, a webhook or email.
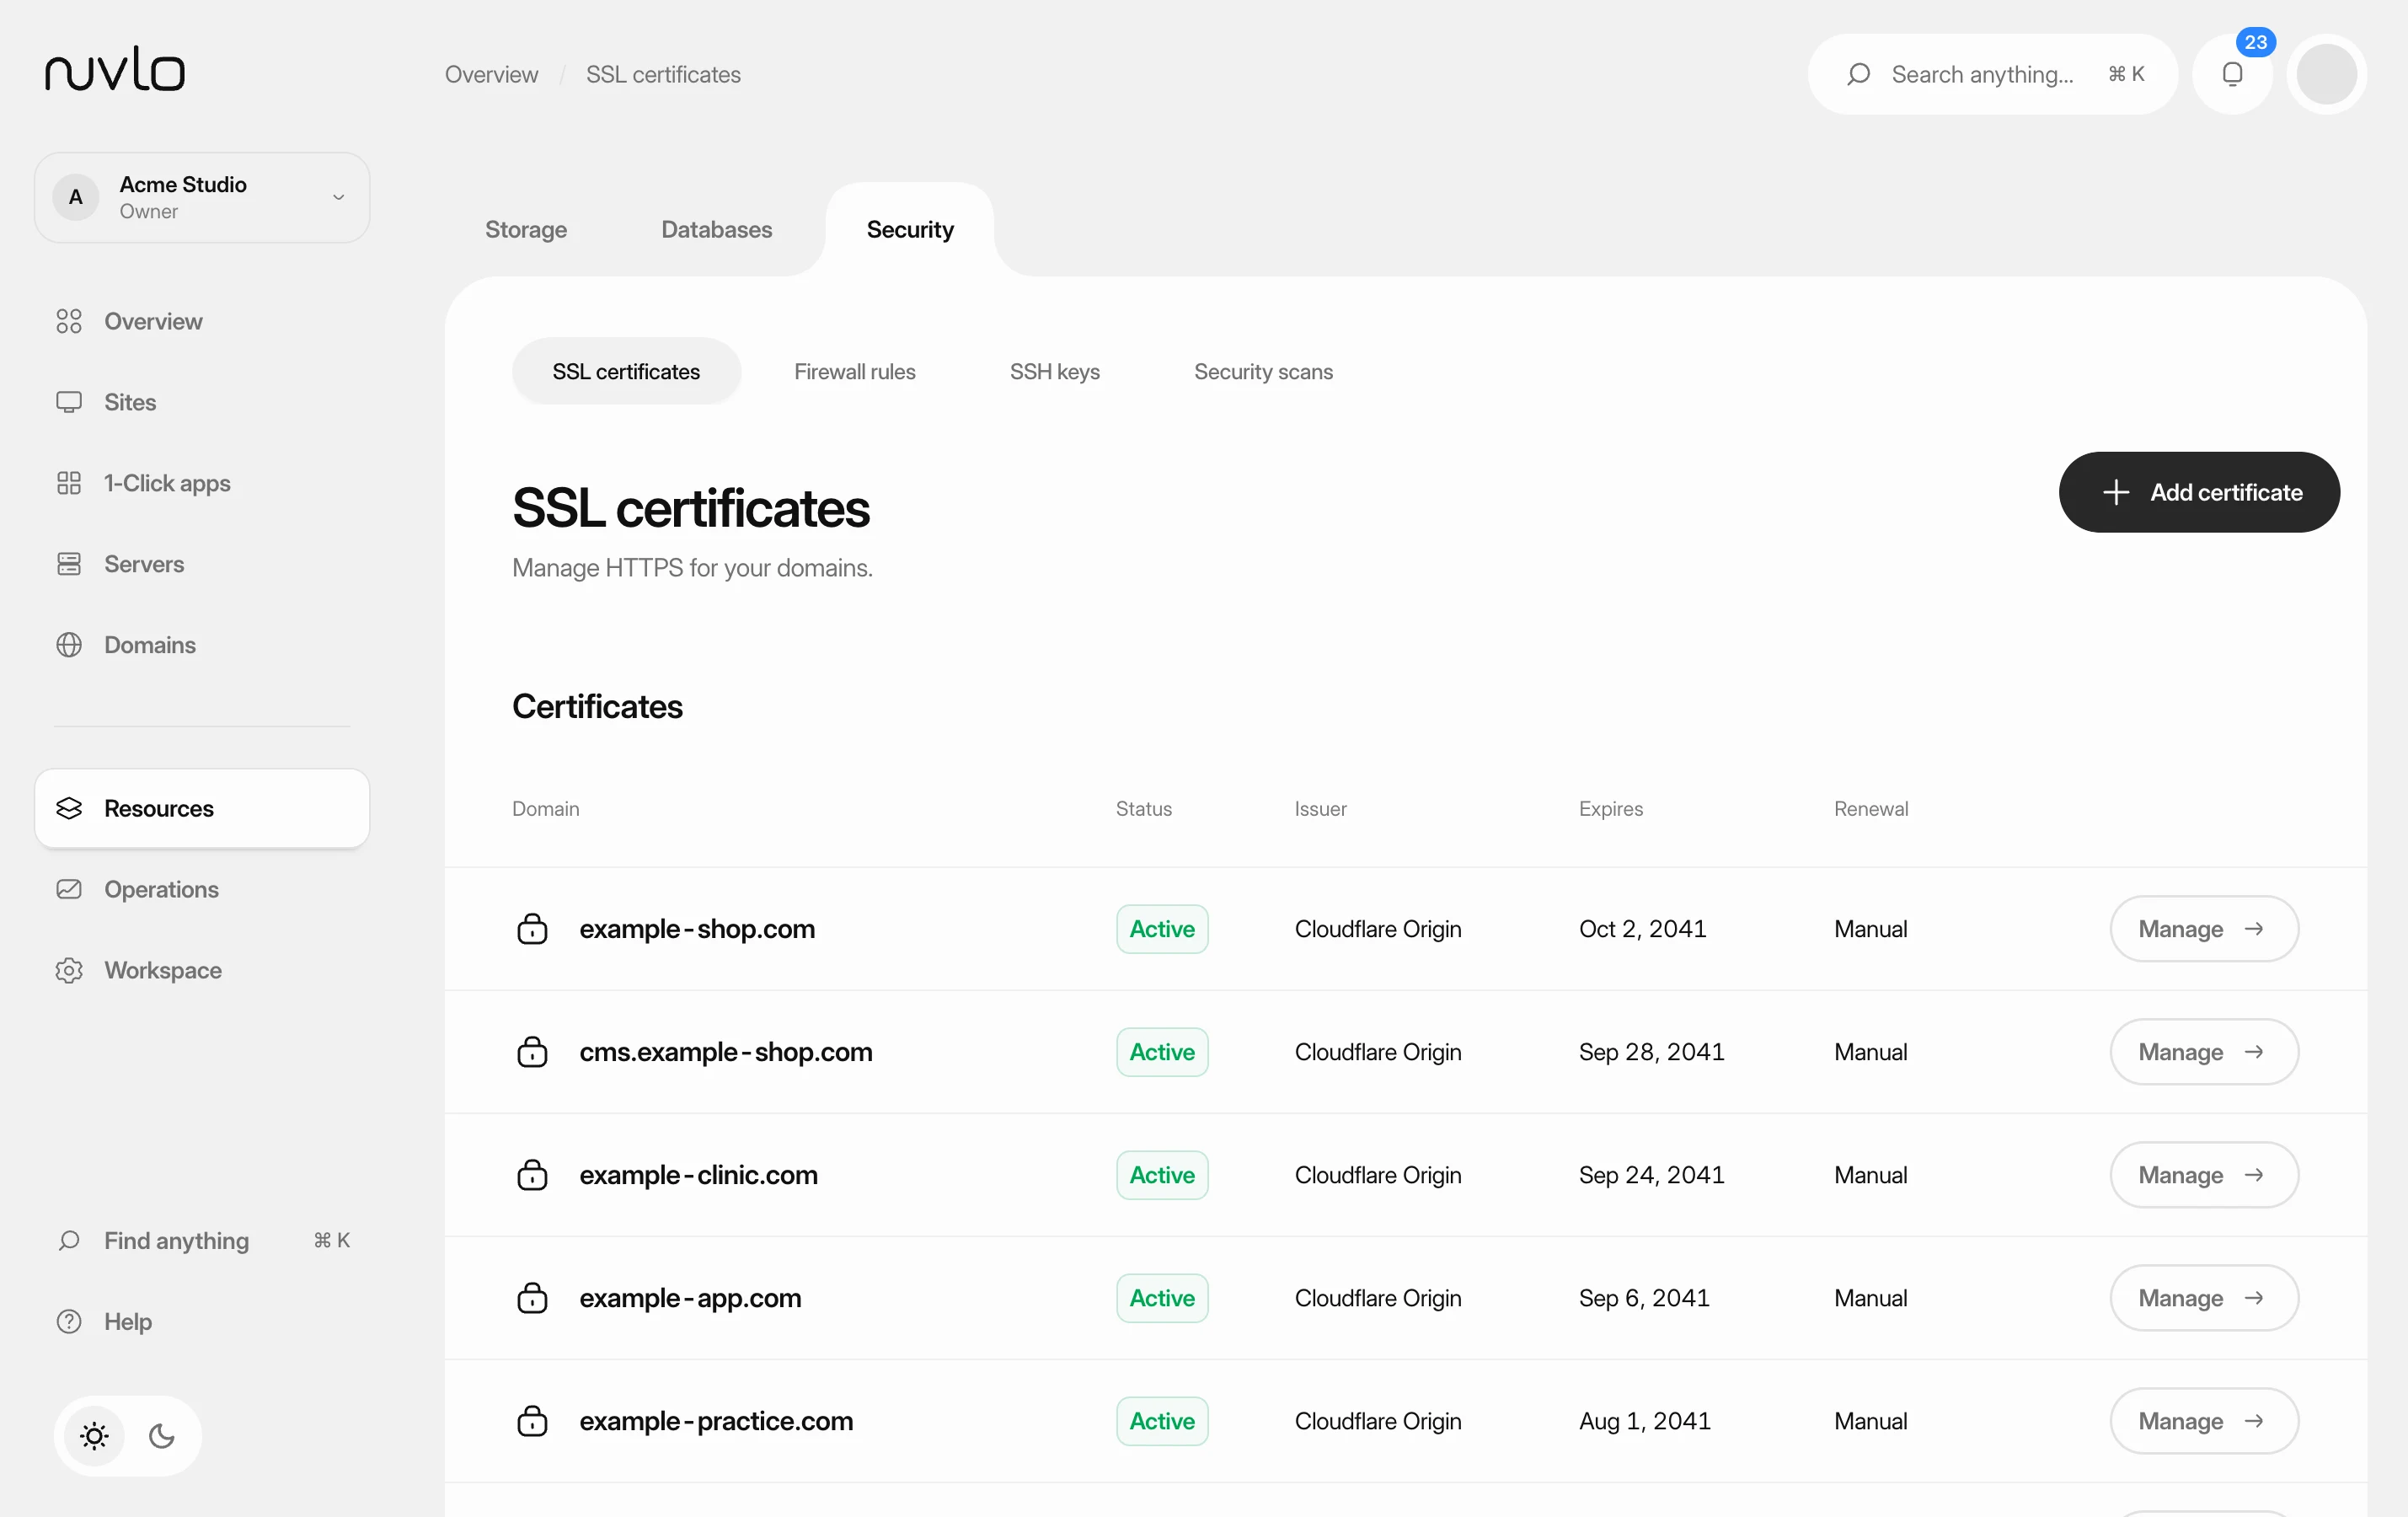 Manage SSL certificatesSee which certificate each domain uses, turn on HTTPS for a site, and know which certificates renew by themselves and which you have to replace.